The latest figures from the UK Government reveal there have been 5,892 deaths in England since the country’s so-called ‘Freedom Day’ on 19 July.
This works out at a rate of 10.4 per 100,000 of the population.
The North East is the worst-hit region in England. It has recorded 476 deaths between 19 July and 25 September, a rate of 17.8 per 100,000 people.
Six of its 12 councils are included in the 20 worst-affected areas.
The figures are based on the number of deaths within 28 days of a positive test, by date of death.
Here we reveal the 20 areas in England which have had the highest death rate since the country reopened.
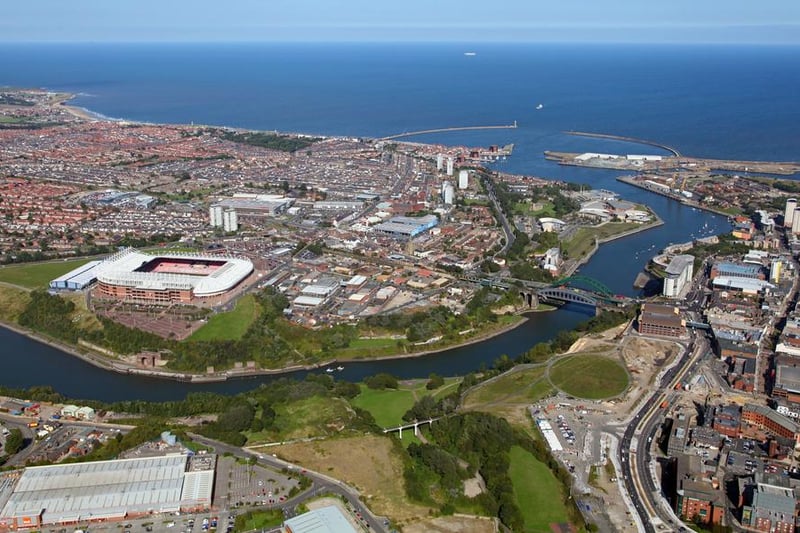
1. Sunderland
There have been 79 deaths in Sunderland. This is a rate of 28.4. Photo: Shutterstock
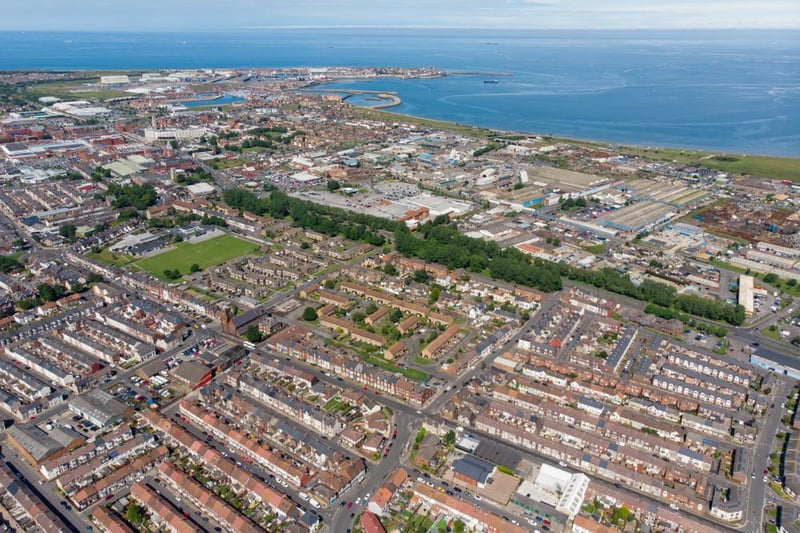
2. Hartlepool
There have been 22 deaths in Hartlepool. This is a rate of 23.4. Photo: Shutterstock
3. Redcar and Cleveland
There have been 32 deaths in Redcar and Cleveland. This is a rate of 23.3. Photo: Shutterstock
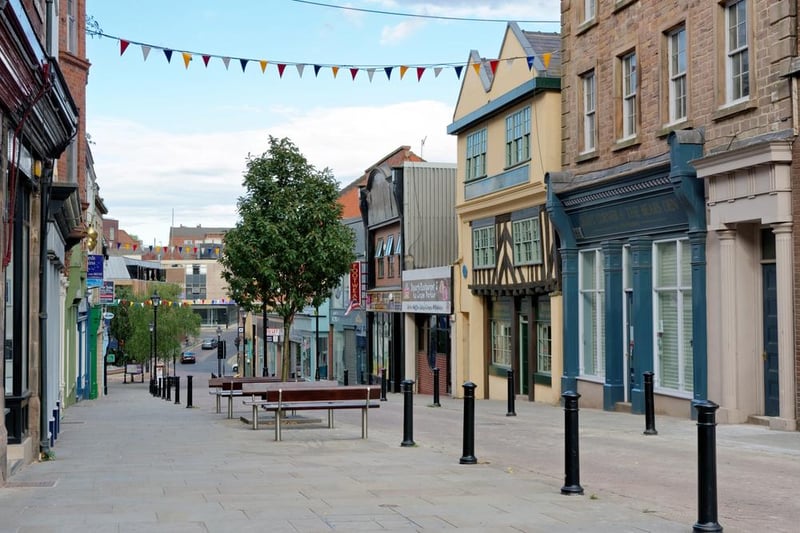
4. Rotherham
There have been 59 deaths in Rotherham. This is a rate of 22.3. Photo: Shutterstock
