The coronavirus pandemic caused an unprecedented economic shock in the UK, closing businesses and putting people out of work left, right and centre.
But despite that, average house prices held up across England and Wales – even if there was a drop in sales.
Prices rose by 4.1% between October 2019 and September 2020 compared to the same period the year before, reaching an average of £310,782, according to the Office for National Statistics. Over that time, the volume of house sales fell by almost a quarter (24%).
The ONS also publishes house price figures by Middle Layer Super Output Areas (MSOAs) – small geographic areas containing an average population of 7,200 people.
These show 4,631 of the more than 7,000 MSOAs in England and Wales saw a rise in house prices over the same period.
Here we reveal which neighbourhoods saw the strongest growth in the year to September 2020.

. pjimage (12).jpg
House prices rose by 4.1% in the year to September 2020 (Photos: Getty / Shutterstock) Photo: Getty / Shutterstock

. Gerrards Cross, Buckinghamshire
Gerrards Cross in South Buckinghamshire saw an annual increase of 271.1%, with prices rising from £1.05 million to £3.88 million. There were 42 sales in the year to September 2020, down 65% from 120 sales the previous year. Photo: Google Maps

. Victoria, Westminster
Prices in Victoria in Westminster rose by 183.5%, from £1.4 million to £3.97 million. There were 73 sales, a drop of only 8%, or six transactions. Photo: Google Maps

. Roehampton North West, Wandsworth
In Roehampton North West in the London Borough of Wandsworth, prices increased to £1.36 million, up by 172.7% from £498,500. Sales were down by 29%, falling from 21 to 15 transactions. Photo: Google Maps

. Old Oak and Wormwood, Hammersmith
Old Oak and Wormwood in Hammersmith, West London, enjoyed a 79.9% boost. Prices increased from £501,364 to £903,889 while sales were up by 203%, from 32 to 97. Photo: Google Maps

. Lambeth North, Waterloo and South Bank
Still in London, the neighbourhood of Lambeth North, Waterloo and South Bank to the south of the Thames saw prices rise by 75.6%. There were 198 transactions, up by 130% from 86 the previous year, with the average sale value increasing from £835,441 to £1.47 million. Photo: Google Maps

. Queen's Park, Brent
In the north of the capital, in the Queen's Park area of Brent, prices were up by 61.1%. Average prices reached £1.45 million, up from £902,146, while sales fell from 127 to 74, a drop of 42%. Photo: Google Maps

. West Brompton, Kensington and Chelsea
The West Brompton area of Kensington and Chelsea is next with a price rise of £60.4%, from £1.03 million to £1.65 million. Overall sales were up by 11%, from 66 to 73. Photo: Google Maps

. Bloomsbury East, Camden
In the last of the London cluster, house prices in Camden’s Bloomsbury East neighbourhood increased by 58.6%, from £534,163 to £847,000. That was from 34 sales, a rise of 70% on the 20 sales the previous year. Photo: Google Maps

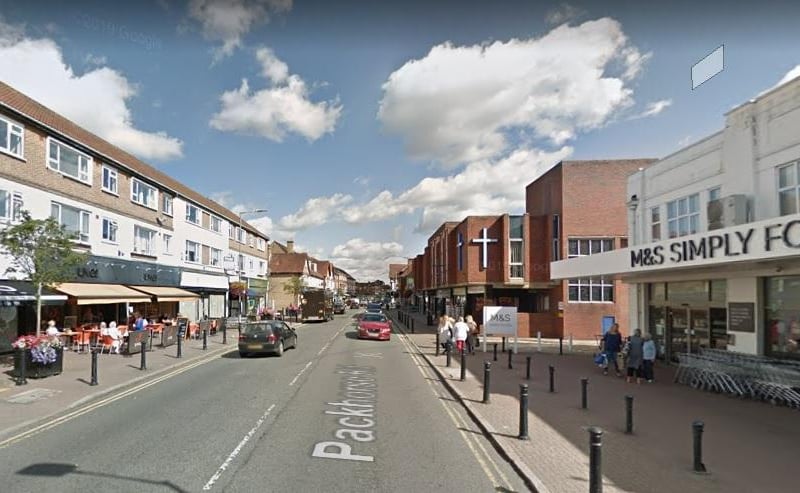
1. Gerrards Cross, Buckinghamshire
Gerrards Cross in South Buckinghamshire saw an annual increase of 271.1%, with prices rising from £1.05 million to £3.88 million. There were 42 sales in the year to September 2020, down 65% from 120 sales the previous year. Photo: Google Maps

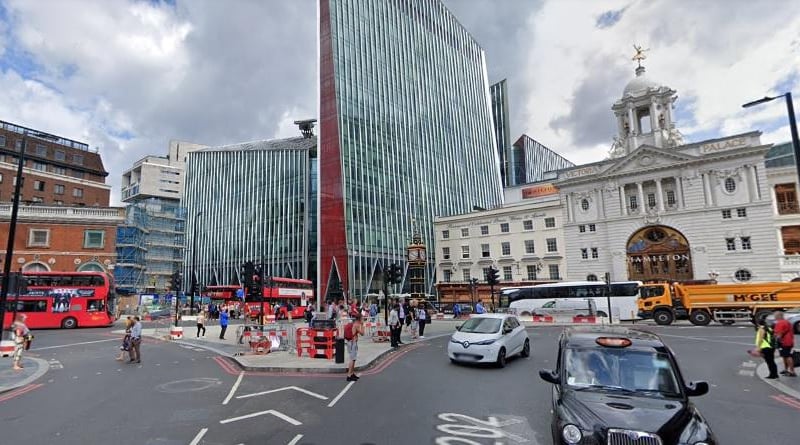
2. Victoria, Westminster
Prices in Victoria in Westminster rose by 183.5%, from £1.4 million to £3.97 million. There were 73 sales, a drop of only 8%, or six transactions. Photo: Google Maps

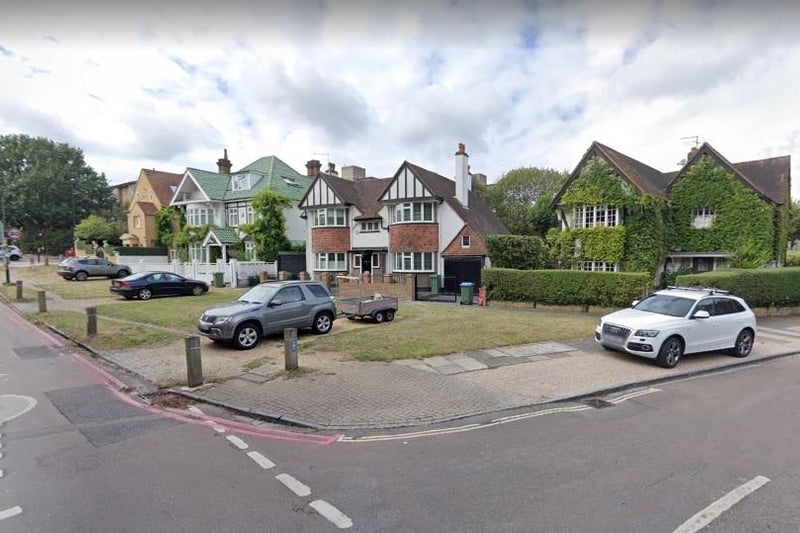
3. Roehampton North West, Wandsworth
In Roehampton North West in the London Borough of Wandsworth, prices increased to £1.36 million, up by 172.7% from £498,500. Sales were down by 29%, falling from 21 to 15 transactions. Photo: Google Maps

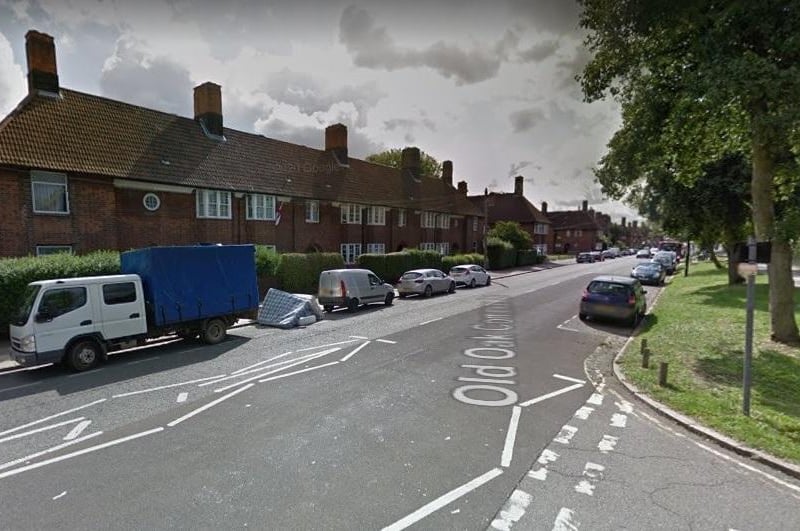
4. Old Oak and Wormwood, Hammersmith
Old Oak and Wormwood in Hammersmith, West London, enjoyed a 79.9% boost. Prices increased from £501,364 to £903,889 while sales were up by 203%, from 32 to 97. Photo: Google Maps