
New study reveals Britain's greenest regions for solar power in 2025
Ynys Môn, also known as Anglesey, breaks national records as the most eco-friendly constituency, with 7,598 solar panels per 100,000 residents. According to the study, areas in Wales installed 38 times more panels than London constituencies in 2025. London sits at rock bottom as Poplar and Limehouse manage a pitiful 198 panels per 100,000 people.
Wales is the most eco-friendly area when considering solar panel installations.
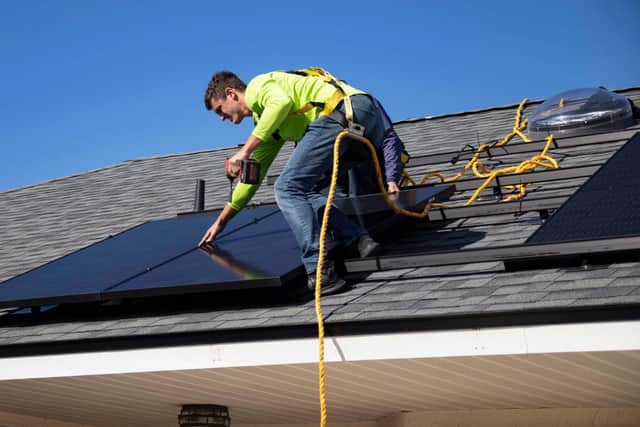

The study, conducted by energy-efficiency experts Green Improve, examined the number of solar panel installations per 100,000 residents in each constituency. The areas with the highest number have been named the most eco-friendly in 2025, revealing a stark divide in renewable energy adoption.
Ynys Môn, or Anglesey, tops Britain's solar charts, with 7,598 installations per 100,000 people. The island has equipped 5,246 properties with solar systems while housing a mere 69,000 residents.
Ceredigion Preseli, also a Welsh constituency, secures the second position nationwide. Homeowners in this coastal region have set up 6,825 solar systems among its 94,000 residents, which equals 7,253 installations per 100,000 people.
North Cornwall ranks third, with 6,369 installations per 100,000 residents. This South West area now has 6,358 solar panel systems powering close to 100,000 locals who now pay much less for electricity.
Central Devon stands fourth. Households there have installed 5,835 solar panel systems across a population of 94,481, which gives this South West constituency 6,176 installations per 100,000 people.
Montgomeryshire and Glyndŵr takes fifth place. Around 6,000 solar systems run across its population of 98,347, with the area hitting 6,023 installations per 100,000 residents.
South Devon, located in the South West of England, ranks sixth. With 5,927 installations per 100,000 residents, solar panels now provide electricity for 5,412 homes throughout its 91,318 population.
Torridge and Tavistock claims seventh place. Locals have installed 5,650 solar systems across the area's 96,538 population, which gives the South West constituency 5,853 installations per 100,000 people.
South Cambridgeshire takes eighth place, with 5,840 installations per 100,000 residents. Welsh constituency Caerfyrddin, also known as Carmarthen, follows in ninth, with 5,686 installations per 100,000 residents. Wells and Mendip Hills in the South West completes the top ten, with 5,626 installations per 100,000 residents.
Table 1: GB areas with the highest number of solar panels
| Rank | Region | Constituency | Installations per 100,000 people |
| 1 | Wales | Ynys Môn | 7,598 |
| 2 | Wales | Ceredigion and Preseli | 7,253 |
| 3 | South West | North Cornwall | 6,369 |
| 4 | South West | Central Devon | 6,176 |
| 5 | Wales | Montgomeryshire and Glyndŵr | 6,023 |
| 6 | South West | South Devon | 5,927 |
| 7 | South West | Torridge and Tavistock | 5,853 |
| 8 | East | South Cambridgeshire | 5,840 |
| 9 | Wales | Caerfyrddin | 5,686 |
| 10 | South West | Wells and Mendip Hills | 5,626 |
On the other hand, London's Poplar and Limehouse ranks last nationwide, with 198 installations per 100,000 residents. The constituency installed 290 solar panels despite having a population of over 146,000. The disparity between top and bottom rankings shows solar panel adoption in Ynys Môn is 38 times higher than in Poplar and Limehouse.
Bethnal Green and Stepney follow in second, with 199 installations per 100,000 residents. The London constituency has only 264 solar panel systems serving its population of almost 133,000. This represents just 2.6% of the installation rate seen in top-ranked Ynys Môn.
Kensington and Bayswater rank third, with just 213 installations per 100,000 residents, followed by Chelsea and Fulham in fourth, with 241 installations per 100,000 residents. Bermondsey and Old Southwark round out the bottom five, with 271 solar panel installations per 100,000 residents.
Table 2: GB areas with the fewest number of solar panel installations
| Rank | Region | Constituency | Installations per 100,000 people |
| 1 | London | Poplar and Limehouse | 198 |
| 2 | London | Bethnal Green and Stepney | 199 |
| 3 | London | Kensington and Bayswater | 213 |
| 4 | London | Chelsea and Fulham | 241 |
| 5 | London | Bermondsey and Old Southwark | 271 |
| 6 | London | Islington South and Finsbury | 283 |
| 7 | London | Stratford and Bow | 292 |
| 8 | London | Queen's Park and Maida Vale | 295 |
| 9 | London | East Ham | 296 |
| 10 | London | Cities of London and Westminster | 298 |
Daniel McCowan, Director of Green Improve, comments, "These findings highlight the significant regional differences in renewable energy adoption across Great Britain. The concentration of solar panels in Welsh and South Western constituencies shows how these communities are embracing sustainable energy solutions.
"The stark contrast between Ynys Môn, otherwise known as Anglesey, with over 7,500 installations per 100,000 people, and London areas, with fewer than 200, raises important questions about access to renewable technology.
"As energy costs remain high, solar panels offer a practical way to reduce long-term expenses while contributing to national carbon reduction targets. Communities that invest in renewable infrastructure now will be better positioned for future energy challenges."
Information provided by: https://greenimprove.co.uk/
Methodology
Data was gathered from the Department for Energy Security & Net Zero (DESNZ) Solar Photovoltaics deployment statistics for February 2025. The statistics present data on capacity and the number of solar photovoltaic schemes installed in constituencies across Great Britain, based on the latest parliamentary constituencies used in the July 2024 General Election.
Source
- Department for Energy Security & Net Zero