
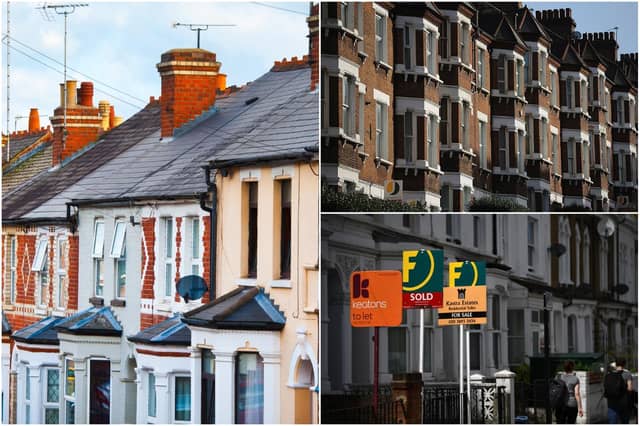


The coronavirus pandemic caused an unprecedented economic shock in the UK, closing businesses and putting people out of work left, right and centre.
But despite that, average house prices held up across England and Wales – even if there was a drop in sales.
Prices rose by 4.1% between October 2019 and September 2020 compared to the same period the year before, reaching an average of £310,782, according to the Office for National Statistics. Over that time, the volume of house sales fell by almost a quarter (24%).
The ONS also publishes house price figures by Middle Layer Super Output Areas (MSOAs) – small geographic areas containing an average population of 7,200 people.
These show 4,631 of the more than 7,000 MSOAs in England and Wales saw a rise in house prices over the same period.
Here we reveal which neighbourhoods saw the strongest growth in the year to September 2020.
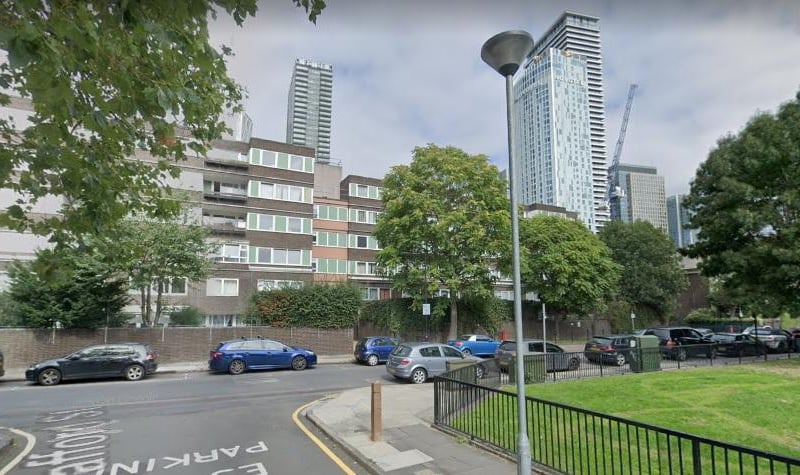
17. Millwall North, Tower Hamlets
In Millwall North, in the London Borough of Tower Hamlets, prices reached £631,686, up by 45.5% on the £434,106 average price the year before. Sales were also up by 71%, from 112 to 192. Photo: Google Maps
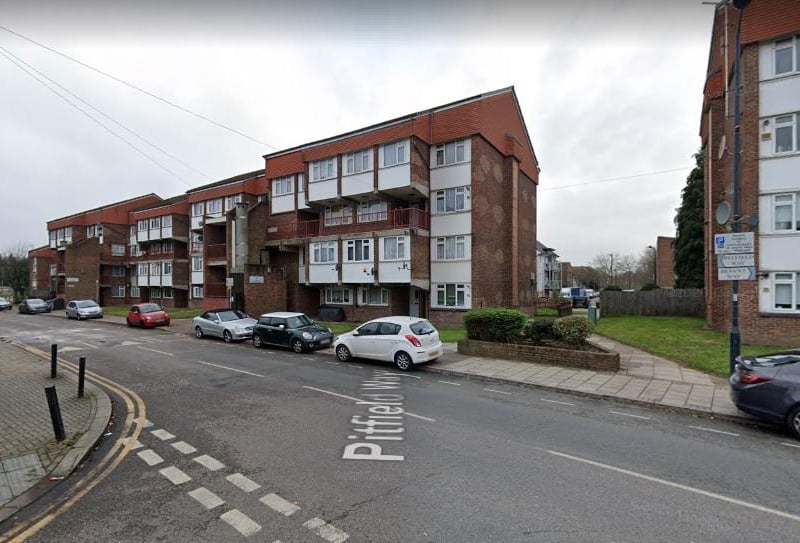
18. St Raphael’s, Brent
Prices rose by 44.6% in St Raphael’s in Brent, up from £301,191 to £435,562. Sales were down by 43%, dropping from 14 to just eight. Photo: Google Maps
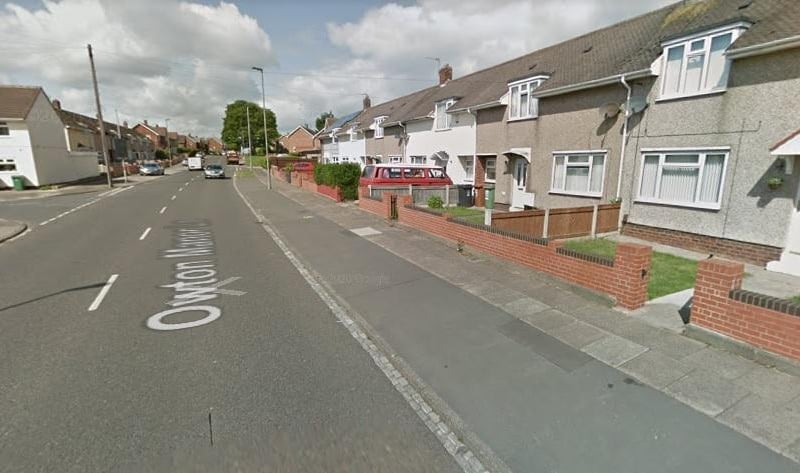
19. Owton Manor, Hartlepool
The Owton Manor area of Hartlepool saw prices climb from £85,083 to £122,537, a rise of 42.8%. Sales were down by 40%, from 53 to 32. Photo: Google Maps
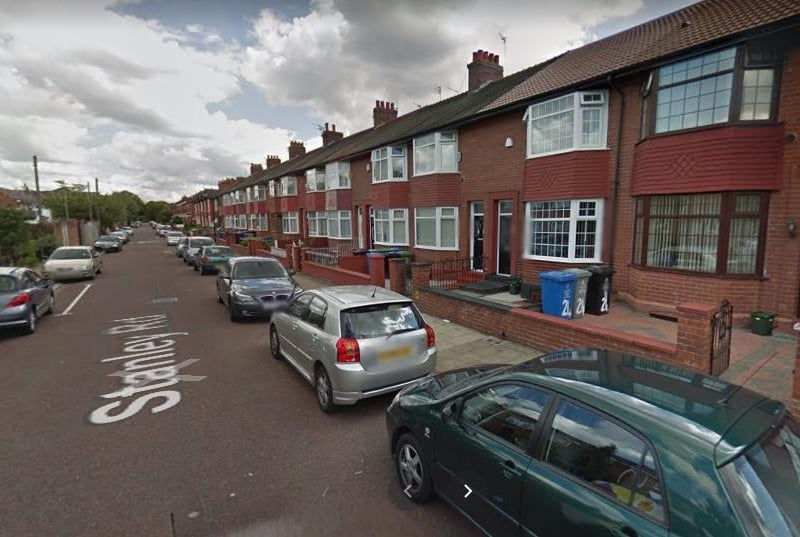
20. Old Trafford, Manchester
The Old Trafford area of Manchester experienced a price hike of 42.8%. Prices rose from £125,826 to £179,682 while sales fell by a whopping 82%, from 319 to 56. Photo: Google Maps