
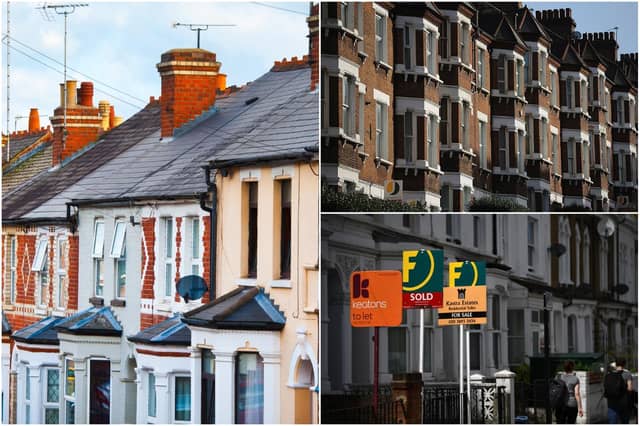


The coronavirus pandemic caused an unprecedented economic shock in the UK, closing businesses and putting people out of work left, right and centre.
But despite that, average house prices held up across England and Wales – even if there was a drop in sales.
Prices rose by 4.1% between October 2019 and September 2020 compared to the same period the year before, reaching an average of £310,782, according to the Office for National Statistics. Over that time, the volume of house sales fell by almost a quarter (24%).
The ONS also publishes house price figures by Middle Layer Super Output Areas (MSOAs) – small geographic areas containing an average population of 7,200 people.
These show 4,631 of the more than 7,000 MSOAs in England and Wales saw a rise in house prices over the same period.
Here we reveal which neighbourhoods saw the strongest growth in the year to September 2020.
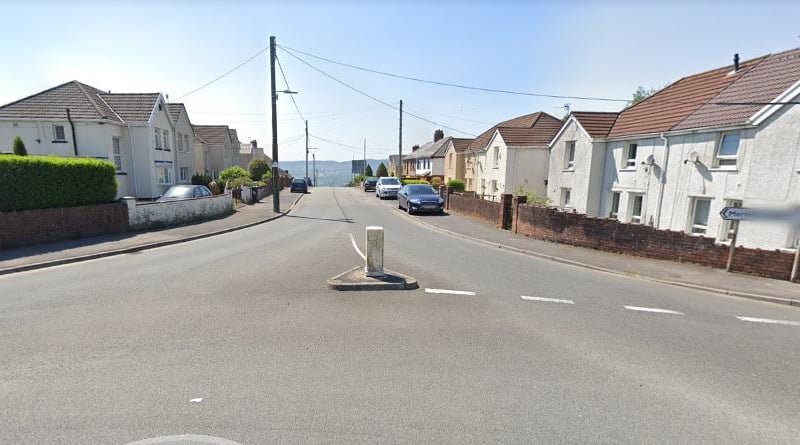
21. Gurnos, Trefechan & Pontsticill, Merthyr Tydfil
The only entry for Wales on this list, house prices in Gurnos, Trefechan & Pontsticill in Merthyr Tydfil grew by 41.2%, from £110,373 to £155,840. Sales were down 21%, from 52 to 41. Photo: Google Maps
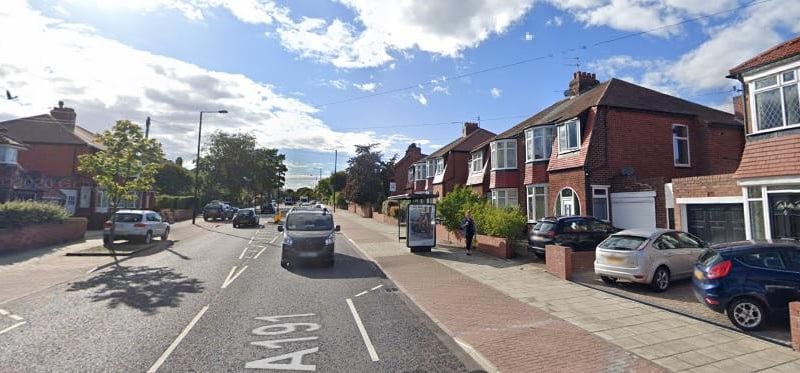
22. Kenton, Newcastle
In Newcastle, the Kenton neighbourhood saw prices rise by 40.7%, from £162,306 to £228,343. Sales were down by 40%, from 124 to 75. Photo: Google Maps
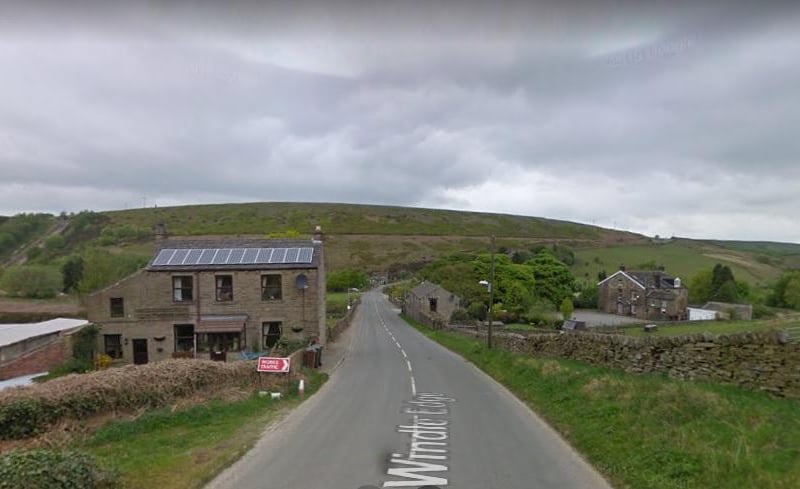
23. Ingbirchworth, Dunford Bridge and Thurgoland, Barnsley
The Ingbirchworth, Dunford Bridge and Thurgoland area of Barnsley experienced a 40% price rise, from £259,536 to £363,311. Sales faltered by 30%, falling from 89 to 62. Photo: Google Maps
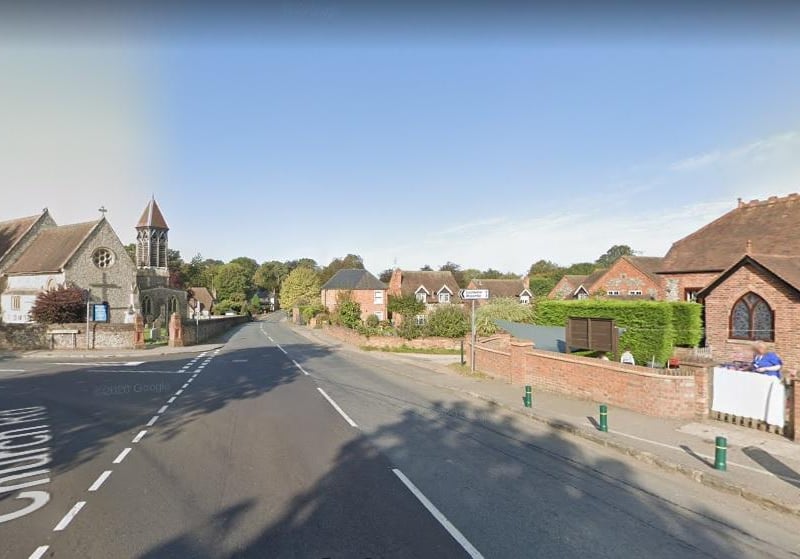
24. Tylers Green
In Wycombe in Buckinghamshire, the Tylers Green area saw prices rise by 39.7%, from £516,356 to £721,495. Sales were down by 64%, from 70 to 25. Photo: Google Maps