Are shootings on the rise in the UK? Firearms offences explained in five charts amid Liverpool gun violence

and live on Freeview channel 276
News of the deadly shooting of a nine-year-old girl has rocked the city of Liverpool and the wider UK this week.
Schoolgirl Olivia Pratt Korbel was shot dead, and her mum Cheryl, 46, and an unnamed man, 35, injured, after a gunman burst into the family home in Dovecot, Liverpool, on Monday night (22 August).
Advertisement
Hide AdAdvertisement
Hide AdMerseyside Police said the shooter fired into the house after chasing the 35-year-old, who had forced his way through the door when Olivia’s mother had looked outside after hearing a commotion. The target has since been arrested, while police continue to hunt the gunman.

The incident – the third fatal shooting in Liverpool in a week, and the eighth in England since 19 July – has prompted concerns about gun violence and the supply of weapons on the city’s streets.
Official figures suggest there had been a national rise in fatalities from shootings even before the summer of violence experienced across England in recent weeks.
But how many people are killed in shootings each year, and how pervasive are firearms offences across the country?
Advertisement
Hide AdAdvertisement
Hide AdHere’s everything you need to know about gun crime and the recent rise in killings.
How many people are killed by shootings in the UK?
The latest Office for National Statistics (ONS) figures on homicides (murders and manslaughters) involving shootings only cover the year ending March 2021 (2020/2021).
These show an increase in shooting homicides that year across England and Wales – despite a drop in both overall homicides and firearms offences in general during Covid.
There were 35 killings in 2020/21, five more than during 2019/20 and a nine-year high.
Advertisement
Hide AdAdvertisement
Hide AdThis annual total would suggest an average rate of just under three killings per month, or 0.1 per day.
You can see how many homicides involving shootings were recorded annually since 2011 in the chart below. Can’t see the graph? Open it in a new window here.
Loading....
Between 19 July and 22 August this year, there were eight fatal shootings in England and Wales, according to news reports - four in London, three in Liverpool and one in Manchester.
That gives a rate of shootings during that period twice the daily average for 2020/21, at 0.2 per day. But when counting since the start of the financial year in April, the rate is currently lower than the 2020/21 average.
Advertisement
Hide AdAdvertisement
Hide AdThere is also no accounting for whether the killings in 2020/21 also fell disproportionately in summer months, or whether the high rate of killings seen in recent weeks will continue.
The eight recent shootings will be included in data for the year ending March 2023, when it is released, while the year ending March 2022 will also include victims of the Plymouth mass shooting, when Jake Davison killed five people in an attack during August 2021.
Figures for Northern Ireland and Scotland are published separately.
How many gun crimes are committed in the UK?
The ONS also publishes statistics on firearm offences, the latest of which cover the year to March 2022.
Advertisement
Hide AdAdvertisement
Hide AdThese show there was a slight annual increase in the number of gun crimes recorded by police in England and Wales in 2021/22 – 5,752, up from 5,715 the year before (+1%). This does not include offences involving air weapons, of which there are thousands each year.
However, the total in 2021/22 is still 13% lower than the last pre-pandemic year (2019/20), when there were 6,618, with the number of recorded crimes having fallen significantly since 2010.
Matching figures for Scotland and Northern Ireland are not available.
You can see how many firearms offences have been recorded each year across England and Wales in the chart below. Can’t see the graph? Open it in a new window here.
Advertisement
Hide AdAdvertisement
Hide AdLoading....
While a rate of 16 firearms offences per day in 2021/22 may seem like a lot, the crimes involved are of varying severity.
Besides shotguns, handguns, rifles, imitation firearms and BB guns, the category of firearms also includes pepper spray, CS gas and stun guns, which account for hundreds of offences between them.
The chart below breaks down the number of firearms offences in 2020/21 (the latest year this data is available for) by the type of weapon involved. Can’t see the chart? Click here to open it in a new window.
Loading....
Firearms offences also encompass a wide-range of crimes from murder and robbery to criminal damage as well as possession charges, with the majority of offences not resulting in injuries.
Advertisement
Hide AdAdvertisement
Hide AdDetailed ONS figures on firearm offences for the year ending March 2021 show weapons (excluding air weapons) were fired 42% of the time, used as a threat 55% of the time, and used as a blunt instrument to hit victims with 3% of the time.
Criminals wielding less deadly air weapons are more likely to fire them (55% of offences).
Overall, the number of offences resulting in a weapon being fired had fallen for three consecutive years as of 2020/21.
The below chart shows the number of times firearms were fired during offences since 2004/2005. Can’t see the chart? Click here to open it in a new window.
Advertisement
Hide AdAdvertisement
Hide AdLoading....
The data also shows that only one in five offences (21%) resulted in a fatality or injury – one in six (18%) if you include air weapons.
Of the more than 5,700 non-air weapon offences recorded in 2020/21, 227 resulted in serious injuries and 954 in slight injuries.
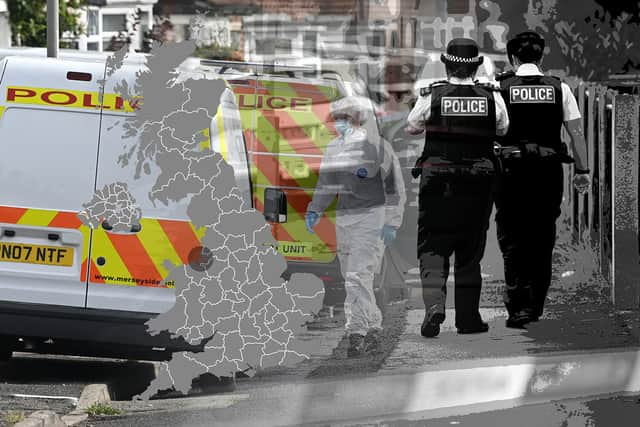
Where is gun crime the most common?
Liverpool has experienced a wave of deadly violence in recent days – and ONS figures show the city does experience a higher than average number of firearms offences.
The police force area with the highest rate of offending in 2021/22 was Cleveland, however, with the force recording 3 firearms offences per 100,000 people (our ranking excludes the City of London, which has a very small population). That was followed by West Midlands Police on 20 and Greater Manchester on 18.
Advertisement
Hide AdAdvertisement
Hide AdThe average rate across the two countries was 10 per 100,000. The Metropolitan Police saw 12, and Merseyside saw 15.
No local breakdown of shooting homicides is published.
The map below shows which police force areas record the most firearms offences per head of the population, and which experienced the biggest rise last year. Can’t see the chart? Click here to open it in a new window.
Loading....
Merseyside did however experience one of the sharpest increases in firearms offences last year, with the number rising by 51%, from 140 in 2020/21 to 222 in 2021/22. This was still lower than pre-pandemic – 227 offences were recorded by the force in 2019/20.
Across England and Wales as a whole, the number of offences increased by under 1%.
Advertisement
Hide AdAdvertisement
Hide AdWhat about shootings in Scotland and Northern Ireland?
The figures quoted above are for England and Wales only. The ONS does not usually publish crime data for Northern Ireland or Scotland, where justice is devolved.
While monthly data from the Police Service of Northern Ireland shows a rise in homicides in the year to June 2022 (25, up from 16 in the year to June 2021) it provides no breakdown on the method of killing.
There is also no overarching count of offences involving firearms. Separate data on Northern Ireland’s security situation shows a decline in security-related shootings (those relating to the political situation), from 34 in the year to July 2021 to 26 in the year to July 2022, altbough these include shots fired by security services as well as criminals and terrorists.
In Scotland, official figures on homicides and firearms offences have only been published up to the year ending 2020.
Advertisement
Hide AdAdvertisement
Hide AdOnly one death involving a shooting was recorded that year, down from three the year before, while the number of offences involving firearms (including air weapons) rose by 3% to 341 – still the second lowest since records began in 1980.